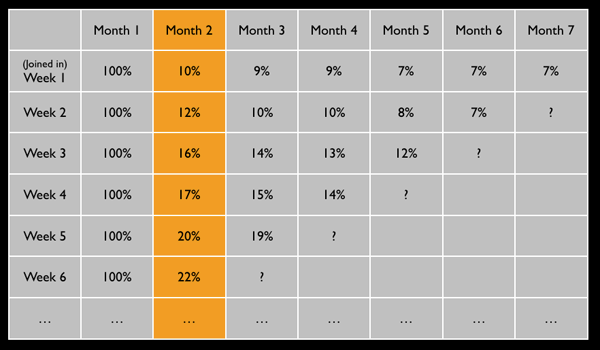
 I’ve become a fan of cohort analysis! Cohorts provide a great way to focus on product development and the effect our RnD is having on customers. Cohort analysis tells us if we’re making the product better or just adding clutter and obsolete features.
Often it would be the best to “simply” focus on the existing features and make them even better. And as often, in my experience, we tend to consider the existing features done and want to make new exciting stuff that the customers are bound to adore and enjoy.
Eric Ries puts this well in the context of web startups on Techcrunch:
Most product teams don’t know if they are making their product better or worse; that’s why customers feel a twinge of fear every time they have to update or upgrade. Despite this, those same companies may be having extremely fast growth because even though the product is getting worse, other things are going right: network effects are kicking in, the company is being lauded in the press, or they are surfing on a general wave of growth in their industry.
So instead measuring just the averages, we want to utilize cohort analysis. A “cohort” may be the set of people who signed up during a specific month. For example: Do the people who signed up this month convert to buyers at a higher rate than those who signed up last month? If the conversion rate remains the same, we just wasted a month of RnD effort!
How is this different from measuring the overall conversion rate?
The difference is that using cohorts, you will know which feature or addition got your audience’s attention. This is like utilizing A/B testing in product development. And you will be able to track customer life-cycle events. Ash Maurya writes about this in his post 3 Rules to Actionable Metrics in a Lean Startup. By checking the cohort analysis table you can see if the customer retention is going the right direction. Here’s an example table by Ash:

I can’t wait to find out our numbers. Lot’s of SQL:ing to do…